Braggfan
In the beginning there was nothing, which exploded
- May 12, 2014
- 2,034
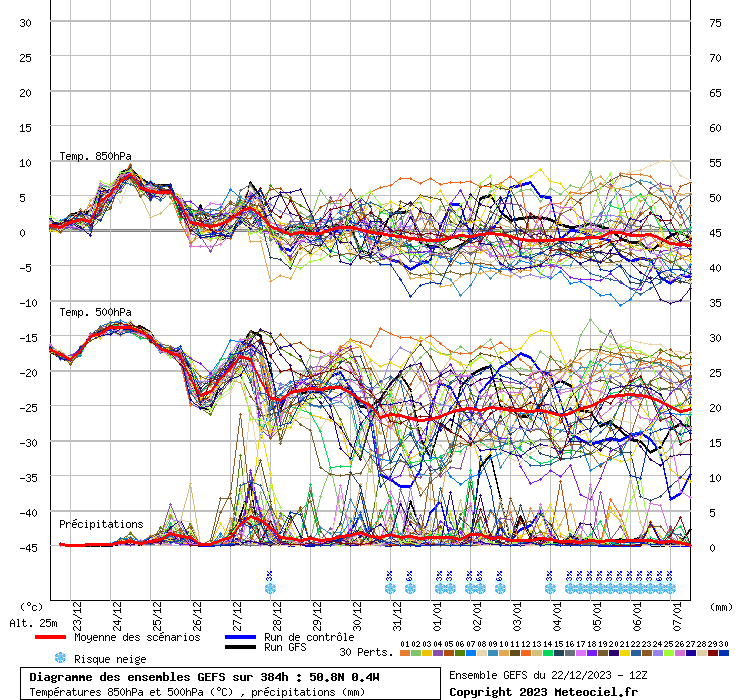
To try and explain, that plot represents the outcome of 23 different computer forecast runs, each with slightly different parameters, resolution etc. It allows forecasters to understand the chances of any specific synoptic outcome being 'true'.
This may help. This diagram is today's (latest) GFS ensemble, but in a better format. This one shows surface temp (at 2m), rainfall and snow percentage chance for somewhere Worthingish.
View attachment 132381
The Operational Run, which is the one published and used by most automated phone apps is the thick black line. This run and the thick blue (the control) are both run at a higher resolution to the others, so should be more reliable (resolution refers to the number of data points modelled globally per the forecast). both of these runs go for the possible N / NE / E blast from about the 21st, with sub zero daytime / night-time temperatures and undoubtedly snow. They are in the cold cluster I've marked.
Alternatively, there are milder options available.
It's a hard one to call.
There are of course many other models to look at. the ECMWF is the best of the rest (probably the most reliable of them all), but they only provide ALL their data if you pay for it. What we can see is their Op run, which goes coldish (but it pushes the coldest air to our West into the Atlantic) and their ensemble 'clusters'. These show the grouped options available in their ensemble.
View attachment 132382
This might seem hard to interpret, but it shows the clusters top to bottom over 3 days (left to right). Each shows the relative pressure over NW Europe.
Cluster 1, with 19 members shows high pressure over Greenland and the pole, with low pressure to the south. This would be cold for Scotland and Northern England, but would probably be milder and wet for us. This group keeps that setup throughout.
Cluster 2 & 3 with 13 & 9 members both start with a Greenland high with a mid Atlantic ridge. These would all be cold for the UK, with snow. They both keep the cold for the 3 days.
Cluster 4, with 6 members for the UK is much the same as cluster 1.
Cluster 5 from our perspective is like 2 & 3.
So, from this run, for the period 21-23 Jan. We have:
Cold & Snow chance for Sussex (cluster:2, 3, 5) = 26
Milder for Sussex, but colder periods (1 & 4) = 25
On a knife edge.
I'm really sorry, this reply is well over due especially as you went to the trouble of explaining it for me, which I really appreciate, thank you. I think I must have been having a brain fog when I first looked at it and posted my comment, but your reply was great and made it very clear.
I've been checking those sites regualrly since now that I'm understanding them. It's always intersting to read your thoughts on the weather and the insights you glean from the data. Cheers


