Stato
Well-known member
- Dec 21, 2011
- 7,556
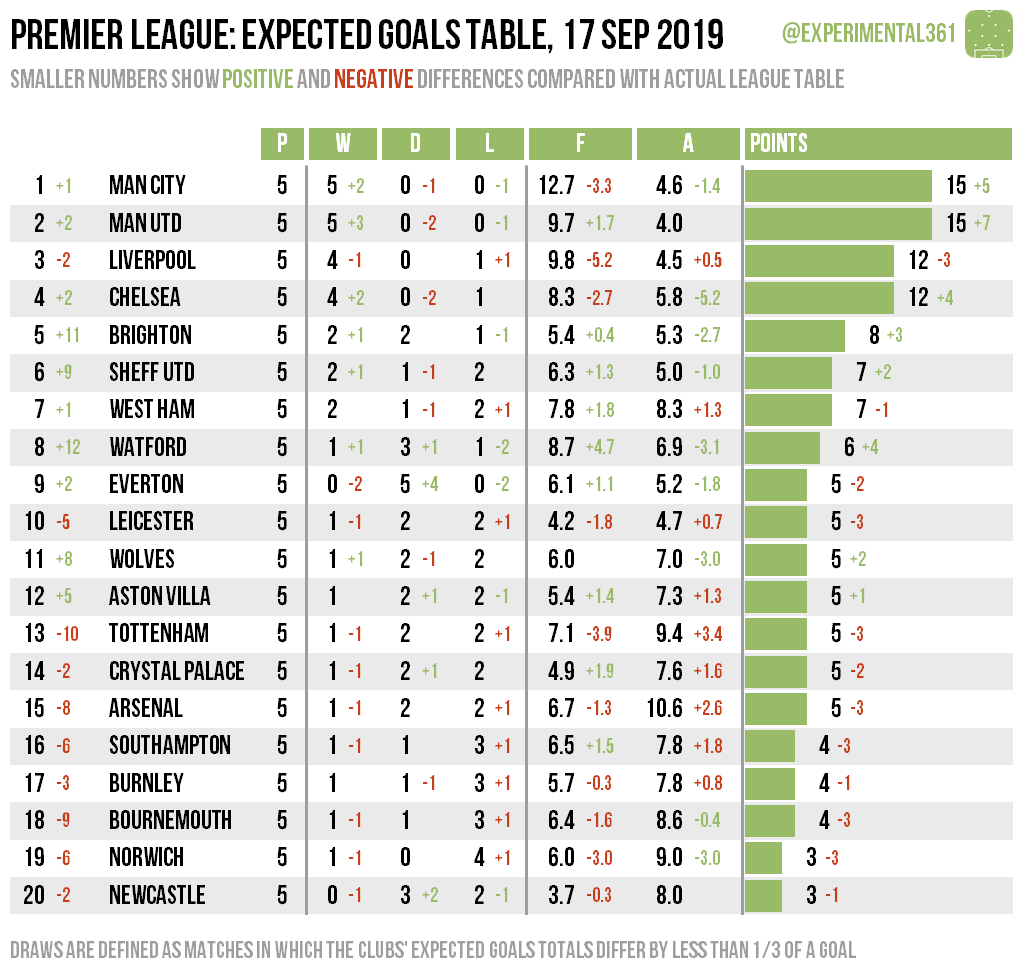
One drawback in being in the top league is that the brains behind Experimental 3-6-1 generally concern themselves more with the Football League. However, they have produced scatter graphs on various stats for the PL so far this season. It makes for interesting, yet still not clarifying reading on the new approach so far:
https://experimental361.com/2019/09/17/scatter-graphics-premier-league-17-sep-2019/
In terms of shot dominance, our possession based approach puts us in the top half. However, as we all have witnessed, our attacking effectiveness needs improvement. We're in the bottom 5 for shots taken per match and the bottom 8 for the number of shots it takes us to score a goal. Our defending seems a better story. We are in the top half for the number of shots we are facing per match. I would venture to suggest that the poorer looking stat for the number of shots it takes for a team to score against us is slightly skewed by the clinical Man City strikers' impact upon a very small sample data measured over just 5 matches.
My reading would suggest that this supports what we all know anyway. We seem to be on the right track, but its very early days. We obviously need to be creating more chances. Hopefully that will come with time.
The weird readings of these tables seem to be those of Watford and Norwich. Their stats could suggest that they should be in each other's league position. It will interesting to see if Watford start to get better results and whether Norwich can maintain things. The quality of the chances would obviously have an impact, but you could argue that, should they have each other's strikers, Watford would be top four and Norwich would be doomed already.